
Kim, Hoyos, Fernandes, Gile, von Dassow, Munro, Odell
Our studies on pattern forming developmental networks reveal an astonishing robustness to quantitative variation. Such robustness can allow a network to continue functioning in the face of environmental stress, and mutation. We are interested in determining whether this robustness also exists in an oscillator, and the process by which evolution produces robustness in networks.
In the cell cycle, DNA is replicated and a cell divides into two. The endocycle is an abbreviated cell cycle where DNA is repeatedly replicated without cell division, resulting in a cell that accumulates a very high DNA content. Endocycling is a growth strategy used in many organisms, as this allows for larger cells due to the increased DNA available as template for transcription. Because of the lack of cell division and the simpler genetic network responsible for its operation, the endocycle represents a simpler system to study the cell cycle.
We want to determine the core genes and interactions (functional module) responsible for the Drosophila endocycle. This project is a collaboration with the laboratory of Bruce Edgar at the Fred Hutchinson Cancer Research Center. Experiments have identified a variety of cell cycle genes as active during the endocycle: E2F, RBF, Cyclins, DP, and others. Additionally, many of the key interactions between these genes are known. This project combines experiment (to determine the molecular interactions; performed by members of the Edgar lab and the CCD) with modeling (to synthesize the available facts to see whether they can account for the observed behavior) to determine the mechanism of the endocycle. Specifically, we are trying to determine:
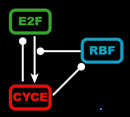
The endocycle model synthesizes the known biological interactions between the gene products summarized below. E2F is a transcriptional activator of CycE, but when bound to RBF, it becomes an inhibitor of CycE production. Both E2F and RBF are continuously transcribed, but their activity is modulated by CycE. High levels of CycE trigger S phase, destruction of E2F, and the phosphorylation of RBF, which causes RBF to release E2F. Additionally, our model incorporates the known transcriptional and translational delays because such delays can have important consequences for the behavior of networks and oscillations.
 |
 |
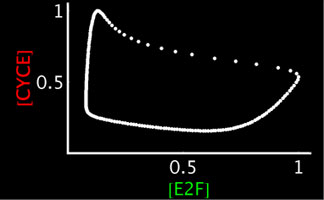 |
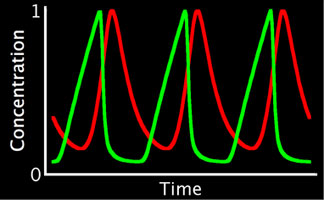
Left: Simplified, high-level schematic showing interactions between 3 of the core genes in the network. Cyclin E (CycE) is periodically produced during the cycle, and oscillates. Lines ending in arrows indicate activation, circles indicate inhibition. Middle: Model output showing oscillations in E2F and CycE concentrations over time. The model can match the qualitative behavior of wild type cycles and those of several mutants. Right: Phase plot of E2F and CycE in the model, showing limit cycle oscillations.
To directly compare the model to experiment, we have developed techniques for quantifying nuclear protein expression form confocal 3-D stacks. This allows us to quantify the oscillations in E2F and Cyclin E (CycE) protein in cycling cells. The endocycle can also be experimentally perturbed (through mutants or overexpressing endocycle genes). We can also measure the rate of endocycling by quantifying the DNA content in cycling cells (which doubles after every cycle), to measure very small changes in the rate of cycling in these mutants. Thus, we can experimentally measure the robustness of the real endocycle, and it appears quite robust to many perturbations. The model of the endocycle is also very robust (like the pattern forming networks we have previously studied), and can reproduce most of the experimental perturbations.
The induction of the C. elegans vulva is a classic system for studying cell signaling and pattern formation. In this, a line of 6 precursor cells each are induced to assume one of 3 cell fates . The mechanistic details of this process are being uncovered, and multiple signaling pathways converge to determine the final cell fate. Briefly, an anchor cell (AC) releases a morphogen that activates the RAS/MAPKP pathway to cause the nearest precursor cell to assume a 1' fate. The adjacent cells assume the 2' fate through Notch/Delta signaling. The wild type pattern of cell fates in the 6 cells is 3-3-2-1-2-3, and the anchor cell is positioned above the 1' cell. Experimentally, this network has been determined to be robust to quantitative variation, mutation, and developmental & environmental noise (such as position of the anchor cell).
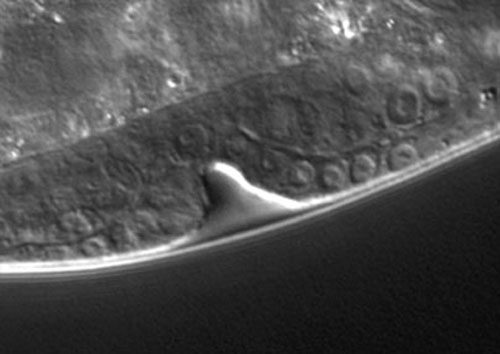
Precursor nuclei are visible on the bottom edge of the L3 larva (shown above). The 1' cells (multiple cells because the initial 1' cell has divided since induction) are located above the indentation, flanked by 2' cells. The anchor cell cannot be seen in this image.
One of the goals of this project is to determine how vulval induction occurs, and how this system achieves its robustness. To do this, we are reconstituting the experimentally determined details into a computer model. This project is a collaboration synthesizing both experiments (performed Josselin Milloz and Fabien Duveau in the lab of Marie-Anne Felix at the Institut Jacques-Monod in Paris, France) and modeling (done by the CCD members). The model is a bridge between mechanism and higher level function (the pattern of induced cells), and is a powerful tool to understand how the network behaves.
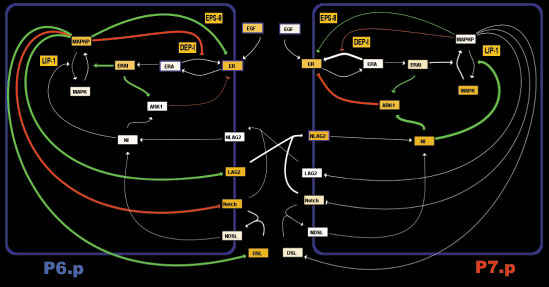
High-level schematic wiring diagram of the interactions between 2 cells in the vulval network. We simulate a row of 6 cells. An anchor cell located above P6.p releases EGF, activating a cascade producing activated MAPK and production of deltas (DSL and LAG2). The deltas activate Notch receptors on neighboring cells, inhibiting MAPK activation and suppressing the 1' fate. We allow for the possibility of autoactivation of notch through DSL (a diffusible delta), while LAG2 is membrane bound and can only activate neighboring cells notch. Finally, the two pathways can interact through the activity of ARK1, DEP1 or EPS8.
This network is conserved and studied in many related species. The effect of mutations and other perturbations to this network can be used to unmask quantitative variation between species. The same mutation can have different effects in different genetic backgrounds, and species differ in the location of the anchor cell and noise. We will also use our modeling to understand the differences in operation and robustness of this network to investigate the mechanistic differences between the strains/species. We will also use the vulva induction network, when complete, to simulate evolution of genetic networks (see below).
The genetic networks in living organisms differ greatly from human-built devices because these networks are a product of evolution rather that deliberate design. One of the great successes of modeling and systems biology is that we are starting to understand principles of how these networks function. Because evolution works through the process of mutation and selection, we hypothesize that genetic networks must be robust to environmental stress and mutations in order to be functionally heritable; a robust network should allow an organism to have an increased chance of survival and thus be selected for.
To test this, we are simulating evolution in a population of individuals. Each individual is endowed with a network (such as the segment polarity or endocycle), and its survival depends on how well its network functions (i.e. networks that produce the correct phenotype of gene expression will allow the individual to live). If an individual survives, it will mate and pass on its network with a low chance of mutation. Using this strategy, we can investigate how the selection criteria, mutation rate, reproduction mode, population size, and ploidy change the network over time. Additionally, we can investigate how speciation/hybrid vigor originate, by simulating reproductively isolated populations that share a common ancestor for several hundred generations. After this, we can test whether matings are viable, and compare the robustness of the hybrid offspring to the parents.
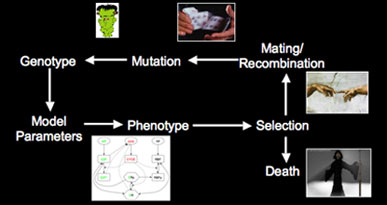 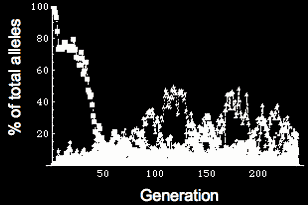 |
Simulating evolution of genetic networks Left: Flowchart for simulating evolution. We represent a population of individuals with a genotype specifying the quantitative behavior of a genetic network. Fitness is determined by the phenotype (expression of genes within the network), and those individuals that produce the correct network behavior mate & reproduce. Reproduction can be either asexual cloning or sexual with recombination, and there is a small chance of mutation in the offspring. With this scheme, we can simulate a population of individuals evolving for thousands of generations. Right: Frequency of different alleles for one of the genes in the network. Initially, the population is clonal, but diversity rapidly arises, and the founder allele becomes extinct due to drift around generation 50. At various times, new alleles become the most prevalent, and are lost either through drift or due to competition with a more robust allele (i.e. an allele that allows the network to coninue working in the face of genetic diversity & mutation in the other genes in the network).