
Detail of early Drosophila cartoon
In the syncytial Drosophila embryo dividing nuclei migrate stepwise to the egg surface (Foe and Alberts, 1983; Baker et al., 1993; von Dassow and Schubiger 1994; see cartoon of early Drosophila embyogenesis [opens new window, 1200 x 900 pixels, 60K]). The migrating somatic nuclei reach the egg surface during the first minute or two of their 10th interphase whereupon the microtubules associated with each nucleus begin interacting with the actin and myosin-rich cortex. At the egg poles, where there is space between the egg cell and its shell, this interaction results in cycles of “budding” and bud breakdown during mitotic cycles 10-14 (movie of Drosophila budding cycles [opens new window, 732 x 696, 179.4 MB]). A bud forms around each cortical nucleus, with bud protrusion starting at telophase, continuing during interphase and collapsing at anaphase. Bud formation provides a transient partial enclosure around nuclei preventing microtubules associated with one nucleus capturing chromosomes from an adjacent nucleus during mitosis, as can happen in this syncytial embryo if bud formation is thwarted (Sullivan et al., 1990; Postner et al., 1992). Along the sides of the elliptical Drosophila egg the shell fits tightly around the egg and buds do not have room to protrude; instead “pseudo-cleavage furrows” draw the plasma membrane down between adjacent nuclei and by this mechanically homologous means cyclically partition adjacent dividing nuclei from one another. We use budding/pseudocleavage cycles in Drosophila to study interactions between microtubules, actin, myosin II and the mitotic oscillator.
In Foe, Field and Odell (2000) we report our studies of the cyclic reorganizations of filamentous actin, myosin II and microtubules observed in syncytial Drosophila blastoderms using drug treatments, time-lapse movies and laser scanning confocal microscopy of fixed stained embryos (including multi-probe three-dimensional reconstructions). Our observations imply interactions between microtubules and the actomyosin cytoskeleton. They provide evidence that filamentous actin and cytoplasmic myosin II are transported along microtubules towards microtubule plus ends with actin and myosin exhibiting different affinities for the cell’s cortex. Our studies further reveal that cell cycle phase modulates the amounts of both polymerized actin and myosin II associated with the cortex. We formulated our findings in terms of four high-level hypotheses about the interactions between microtubules, myosin II, F-actin and the mitotic oscillator that could underlie the results we observed: 1) Mitotic phase modulates the amount of myosin II associated with the cortex and the amount of actin polymerized into filaments at the cortex; independent of the proximity of centrosomes and/or microtubules, both cortical myosin II and cortical F-actin increase from telophase through interphase then fall through metaphase and anaphase; 2) Centrosomes, via the polymerization of the microtubule asters they nucleate, boost the rate of actin polymerization nearby; 3) A kinesin-like activity attaches actin filaments to adjacent microtubules and transports actin filaments towards microtubule plus ends; this activity is weaker than the attachment of F-actin to the cortex; 4) A kinesin-like activity moves myosin II filaments towards microtubule plus ends; this is stronger than the attachment of myosin to the cell’s cortex so that appropriately oriented microtubule arrays contacting the cortex strip myosin II off the plasma membrane. Our ongoing research aims to tease out the molecular processes that underlie these macroscale descriptions of cytoskeletal dynamics.
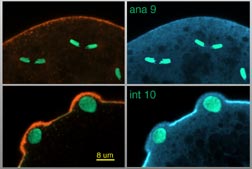
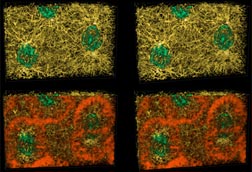
Fig 1 (detail): Cross sectional laser scanning confocal microscope (LSCM) images of the Drosophila embryo anterior showing F-actin (red), myosin II (blue) and nuclei (green).
This image links to a web page with more information and image options. Figure 1 may be viewed in two larger sizes, opening in new windows sized as indicated, the large version [840 x 600 pixels, 68K] or the largest version [1600 x 800 pixels, 1.4MB]. This image has associated movies.
In Foe, Field and Odell (2000) we also suggest how pseudo-cleavage furrow formation in the Drosophila blastoderm may relate to how the mitotic apparatus positions the cleavage furrow for standard cytokinesis, relating our findings to polar relaxation/global contraction mechanisms for furrow formation. The CCD’s ongoing research aims to connect the observations we have made on pseudo-cleavage in Drosophila to normal cytokinesis in echinoderm embryos and to normal cytokinesis and pseudo-cleavage in C. elegans.
Download the complete text [MS Word doc 196K].
Many of the images from Foe, Field and Odell (2000) reproduced on this page are associated with 3D virtual object movies or timelapse movies that were generated with the laser scanning confocal microscope (LSCM) in the course of this research. The pictures link to pages that offer several size options of these movies as well as larger sizes of the 2D images. The movies require Apple QuickTime or later and the larger movies require an internet connection with a robust bandwidth. The large versions of the 2D images will each open in a new window
|
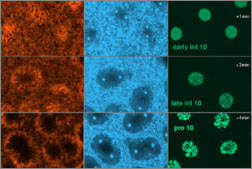
Fig. 2 (detail): F-actin (left column), myosin II and the gamma tubulin component of centrosomes (middle column), and nuclei (right column), from anaphase 9 to early interphase 11 at the cortex of a Drosophila embryo. This image may be viewed in two larger sizes, opening in new windows sized as indicated, the large version [840 x 600 pixels, 264K] or the largest version [1600 x 800 pixels, 7.5MB]. |
|
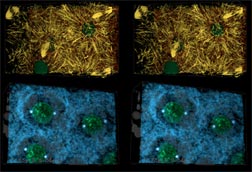
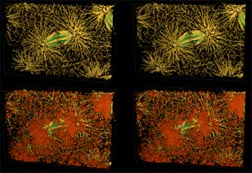
Fig. 3 (detail): Reconstructions of 42 µm wide by 28 µm high by 22 µm deep volumes of Drosophila syncytial blastoderm during early (rows 1-3) and mid (rows 4-6) interphase of cycle 10. This image links to a web page with more information and image options. View large versions of rows 1-3 [840 x 600 pixels, 112K] and rows 4-5 [840 x 600 pixels, 112K] or a very large combined image. [1600 x 800 pixels, 1.6MB]. Each of the above links will open a new window sized as indicated. This image also has associated early interphase movies and mid interphase movies. |
|
Fig. 4 (detail): 3-D reconstructions of prophase 10 (rows 1 and 2) and metaphase 10 (rows 3 and 4), both from apical vantages. ( Color code and general features as in Fig 3.) This image links to a web page with more information and image options. Fig. 4 may be viewed in two larger sizes, opening in new windows sized as indicated, the large version [840 x 600 pixels, 112K] or the largest version [1530 x 800 pixels, 0.9MB]. Fig. 4 also has associated prophase movies and metaphase movies. |
|
Fig. 5 (detail): 3-D reconstruction at anaphase 10. ( Color code and general features as in Fig 3.) This image links to a web page with more information and image options. Fig. 5 may be viewed in two larger sizes, opening in new windows sized as indicated, the large version [840 x 600 pixels, 264K] or the largest version [1530 x 800 pixels, 1.5MB]. This image has associated movies. |
|
Fig. 6 (detail): LSCM micrographs showing polar body nuclei and associated cytoskeletal elements. This image may be viewed in two larger sizes, opening in new windows sized as indicated, the large version [840 x 600 pixels, 316K] or the largest version [1230 x 800 pixels, 760K]. |
|
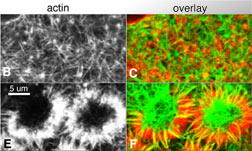
Fig. 7 (detail): Single section, surface view LSCM micrographs of cortical F-actin. This image may be viewed in two larger sizes, opening in new windows sized as indicated, the large version [840 x 600 pixels, 348K] or the largest version [1630 x 800 pixels, 1.6MB]. |
|
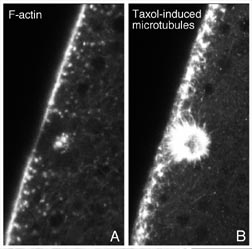
Fig. 8 (detail): Surface view LSCM micrographs of taxol treated embryos. This image may be viewed in two larger sizes, opening in new windows sized as indicated, the large version [840 x 600 pixels, 348K] or the largest version [1630 x 800 pixels, 1.6MB]. |
|
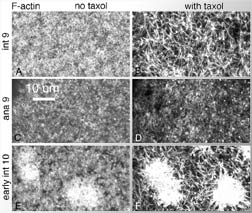
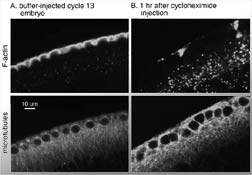
Fig. 9 (detail): F-actin (top row) and microtubules (bottom row) in fixed, stained cycle 13 embryos. Nuclei occupy unstained spheres in bottom panels. This image may be viewed in two larger sizes, opening in new windows sized as indicated, the large version [840 x 600 pixels, 348K] or the largest version [1630 x 800 pixels, 1.6MB]. |
|
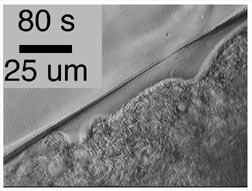
Fig. 10 (detail): Time-lapse movie frames of an embryo injected about 40 minutes previously in interphase 13 with cycloheximide (to interphase arrest) and colcemid (to disrupt microtubules). This image links to a web page with more information and image options. Fig. 10 image may be viewed in a larger size [760 x 600 pixels, 348K]. It also has associated movies. |
|
Fig. 11 (detail): Some consequences of hypotheses H1-H4 working in concert. This image may be viewed in a larger size [700 x 500 pixels, 60K]. |
|
Fig. 12 (detail): Some consequences of hypotheses H1-H4 working in concert. This image may be viewed in a larger size [700 x 500 pixels, 60K]. |