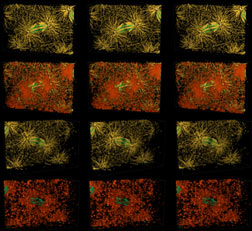
Figure 5. Apical views (top two rows) and basal views (bottom two rows) of a 3-D reconstruction at anaphase 10 ( color code and general features as in Fig 3.). We substantially boosted F-actin's brightness to make its spatial organization visible. ( Fig. 2 [840 x 600 pixels, 264K] shows correct relative concentrations of F-actin and myosin in different mitotic cycle phases.) Most microtubules trace back to the centrosomes that nucleated them. The centrosomes, already replicated, are close together at the spindle poles. F-actin caps are visible in row 2 as they begin to form directly over centrosomes. In row 4, with microtubules invisible, the elevated concentration of F-actin in the regions occupied by asters is easy to see. F-actin particles are distributed throughout the cytoplasm, far from the cortex, but are most concentrated amongst the forming astral microtubules.
Fig. 5 may be viewed in two larger sizes, opening in new windows sized as indicated, the large version [840 x 600 pixels, 264K] or the largest version [1530 x 800 pixels, 1.5MB].
QuickTime version 3 or higher is required for these movies. Visit the apple website to download the latest, free version of QuickTime.
|
3D virtual object movies (interactive) |
tiny [16 MB] |
half size [34 MB] |
full size [124 MB] |
|---|---|---|---|
|
movies (passive viewing) |
half size [72 MB] |
full size [640 X 480 pixels, 286 MB] |
|
pseudo-cleavage and buds project • back
