
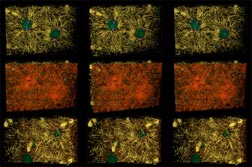
Figure 3 rows 1-3. Reconstructions of 42 µm wide by 28 µm high by 22 µm deep volumes of Drosophila syncytial blastoderm during early (rows 1-3) interphase of cycle 10. This image is comprised of stereo-pairs using a standard color code. Microtubules are yellow, F-actin red, myosin II blue, nuclei green, centrosomes magenta or white, and yolk particles gray. The upper two rows show apical views at early interphase 10 without and with the cortical layer of F-actin rendered. Row 3 is a basal view of the same reconstruction. While most microtubules appear to run back toward centrosomes, very few actually connect to them. Spindle remnants persist into early interphase.
This image may be viewed in two larger sizes, opening in new windows sized as indicated, the large version [840 x 600 pixels, 112K] or the combined largest version [1600 x 800 pixels, 1.6MB].
QuickTime version 3 or higher is required for these movies. Visit the apple website to download the latest, free version of QuickTime.
|
3D virtual object movies (interactive) |
tiny [11 MB] |
half size [25 MB] |
full size [109 MB] |
zoom [154 MB] |
|---|---|---|---|---|
|
movies (passive viewing) |
half size [25 MB] |
full size [640 X 480 pixels, 150 MB] |
||
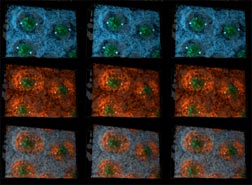
Figure 3 rows 4-6. Reconstructions of 42 µm wide by 28 µm high by 22 µm deep volumes of Drosophila syncytial blastoderm during mid (rows 4-6) interphase of cycle 10. This image is comprised of stereo-pairs usinge a standard color code. Microtubules are yellow, F-actin red, myosin II blue, nuclei green, centrosomes magenta or white, and yolk particles gray. Rows 4-6 show three views all from the same apical vantage at mid-interphase. Row 4 shows myosin II, centrosomes, nuclei, and yolk particles. Row 5 shows F-actin instead of myosin II. Row 6 shows myosin II and F-actin superimposed.
This image may be viewed in two larger sizes, opening in new windows sized as indicated, the large version [840 x 600 pixels, 112K] or the combined largest version [1600 x 800 pixels, 1.6MB].
QuickTime version 3 or higher is required for these movies.
|
3D virtual object movies (interactive) |
tiny [16MB] |
half size [36MB] |
full size [118MB, 640 x 480 pixels] |
|---|---|---|---|
|
movies (passive viewing) |
half size [27MB] |
full size [144MB, 700 x 560 pixels] |
|
These 3-D reconstructions result from extensive image processing of three merged stacks of raw data, each with hundreds of laser scanning confocal micrographs spaced 0.2 µm apart. Computer software we wrote, to be described elsewhere, segments micrographs, picking out structures of interest and rendering as transparent low level fluorescence and non-specific background staining to facilitate seeing deep into the volume reconstructed. In particular, we have rendered invisible a general low level of F-actin and of myosin II staining throughout all the cytoplasm and the viewer must imagine this permeating the much brighter regions of F-actin and myosin II probe shown. With one exception, every part of each the 3-D reconstruction is actual data the LSCM recorded (not a mathematized representation of the data). The exception is that the centrosomes are mathematical spheres placed where gamma tubulin staining shows the centrosomes to be (actual gamma tubulin staining is shown in the middle column of Fig. 2.) Fig. 2 [840 x 600 pixel new window, 264K] shows surface views at the same stages of mitotic cycle 10. We adjusted the brightness of the actin in Figs 3-5 to maximize visibility of F-actin structures, instead of accurately portraying differences in relative probe brightness between mitotic cycle phases as in Fig. 2 [840 x 600 pixel new window, 264K] When locating microtubules and parts of microtubules in these reconstructions, our software found many thousands of short (< 1/2 µm) segments of microtubule probe scattered everywhere throughout the cytoplasm (but most concentrated near the cortex). These bits of microtubule 'chaff' were not arranged along any detectable curve that might have constituted a previously long microtubule clipped into fragments. However we do not believe this is non-specific anti-tubulin staining because microtubule chaff is affected by drugs that affect microtubule polymerization dynamics. We suspect this microtubule chaff results from microtubule nucleating events that fail to produce long microtubules when microtubule minus ends are not stabilized. Rendering the microtubule chaff in the reconstructions makes a blizzard of tiny particles, lacking detectable coherence, which obscures vision deep into the reconstruction. We therefore erased it in the reconstructions.
pseudo-cleavage and buds project • back