In this section, we will focus on the Par/Mex component of the network model. These interactions were synthesized from the current literature. This does not, however, ensure that these interactions are reasonable or representative of the dynamics that are present in the embryo. For the purposes of modelling, we consider the cell to be divided into two compartments, the cortex and the cytoplasm. Proteins can freely diffuse in the cytoplasm but can only redistribute in the cortex by dissociating, diffusing in the cytoplasm, and reattaching to the cortex at another position. To investigate if this network diagram is reasonable, we developed a mathematical model of these interactions and then simulated these numerically.
Network diagram of Par/Mex protein interactions: Par-1, Par-2, and Par-3 proteins undergo exchange between cytoplasmic and cortex-bound states (y vs. x); cortical Par-3 inhibits recruitment of Par-2 to the cortex; cortical Par-2 promotes recruitment of Par-1 to the cortex; cortical Par-1 promotes the activity of a cytoplasmic ubiquitination pathway leading to degradation of Mex-5/6; Mex-5/6 promote cortical recruitment of Par-3.
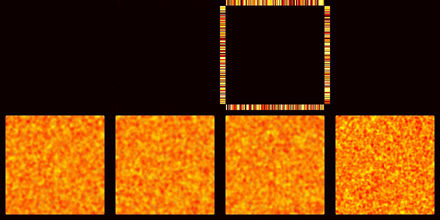
The layout of the simulation (see key below) shows the concentration of each protein in its own 50 micron square cell. Proteins that can bind to the cortex are shown as a ring around the perimeter of the square. Those proteins that are distributed in the cytoplasm are shown in the interior region. The initial conditions are similar to the protein distribution in meiosis II before protein localization occurs in the early embryo. The specific initial value of each point has been assigned by a random number generator to demonstrate how effectively cytoplasmic diffusion can uniformly redistribute proteins, while cortical proteins take longer to reach a uniform distribution. In the simulation, concentrations are mapped to colours such that dark colours indicate low concentrations and light colours indicate high concentrations. The concentration of all the proteins have been scaled with respect to each other so that a direct comparison between squares can be made.
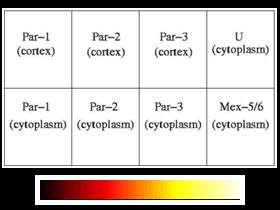
Layout of proteins in numerical simulation, and colour map for protein concentrations; low=black, high=white